Community Driven Approach

Building Community: Spaces That Foster Connection and Address Health Equity


A diverse range of establishments and facilities serves as vital pillars of community development, providing spaces where individuals can meet, communicate, collaborate, and work together to address health equity challenges.

Research Consultants

The Health Equity Agenda employed two groups to help with data and research:

How do we conduct research?

The Health Equity Agenda .worked with local researchers and the community to understand the most frequent health equity issues.

Redstone helps philanthropies, nonprofits, and governments
to solve the world’s most urgent social problems.

Dr. Vicky Gomez and Dr. Rachel Berkowitz, College of Health and Human Sciences, San Jose State University.

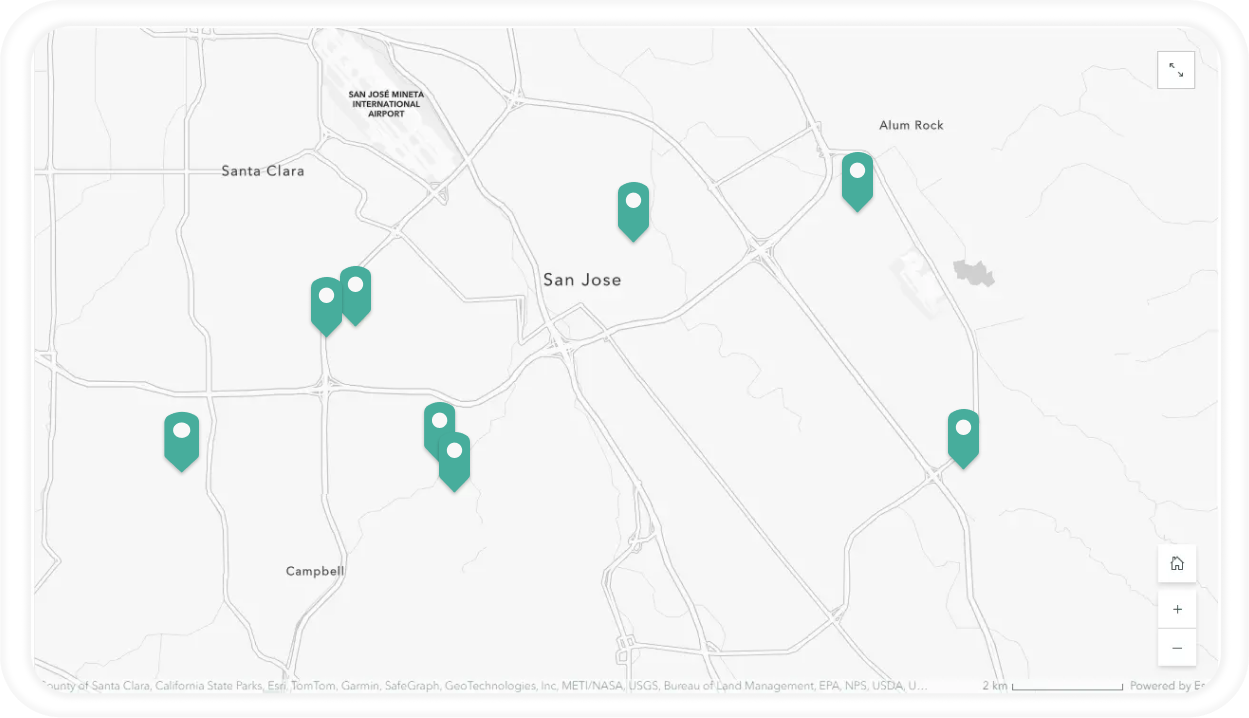
In Santa Clara County, comprehensive interviews were conducted with 13 key stakeholders and 258 individuals. These interviews were held in three languages: 10 in English, 11 in Spanish, and 3 in Vietnamese.

The findings are detailed in the Executive Summary of the 2023 research project, which informs the Health Equity Agenda’s metric tracking and identifies key areas of focus for improving health equity.

Download the Executive Summary to learn more about the insights and future directions of the Health Equity Agenda.

Who did we interview?

See below for a table summarizing the demographics of the interview participants.

Under-Resourced Zip Code

(Gilroy, Morgan Hill, ESJ, < $ 130,890)

69%

Minoritized Racially

(Racially and/or ethnically minoritized.)

86%

Household Income

(Income less than $ 130,890.)

70%

Minoritized Sexual Orientation

(Anytime sexuality was involved.)

9%

Unemployed Individuals

(For more then 1 month in the last year.)

36%

Minoritized Gender

(Anytime sexuality was involved.)

3%

Experienced Homelessness

(Experienced in the last year.)

17%

Speak More than English

(Spoke a secondary language.)

66%

Older Age Individuals

(Older then the age of 65.)

24%

Born Outside of the U.S.

(Not born within the U.S)

59%

Justice Involved

(Anytime justice was involved.)

27%

Disabled Individuals

(Anyone with a disability.)

30%